Free Google Data Studio JSON Connector with Google Sheets or How To Display Matomo Stats in Google Data Studio
You want to display your GDPR-compliant data in Google Data Studio now that you've ditched Google Analytics, but there's no free JSON connector.
Ok, so I found Google Data Studio and thought this is a nice way to set up some simple stats and graphs from a Matomo Statistics instance and maybe throw some Google Search Console insights into the mix. Usually you would give a curious product manager a login, so they can click themselves through all the shiny charts, not knowing what they are looking at. But we are here to learn and let others participate, and that's why I approached it this way.
So what did I do?
I took some Matomo API endpoints like method=Actions.getPageTitles, wired it up with the Data Studio, clicked some charts together and called it a day.
Unfortunately, it wasn't that easy, because the wiring up part lacks the most important tool: A freaking JSON interface to pump some sweet JSON string into the chart bakery.
Searching for JSON connectors reveal some commercial connectors that let you paste one or two JSON data sources for free, and then you can subscribe to some service that you'll use once in a blue moon. There is even a Matomo connector.
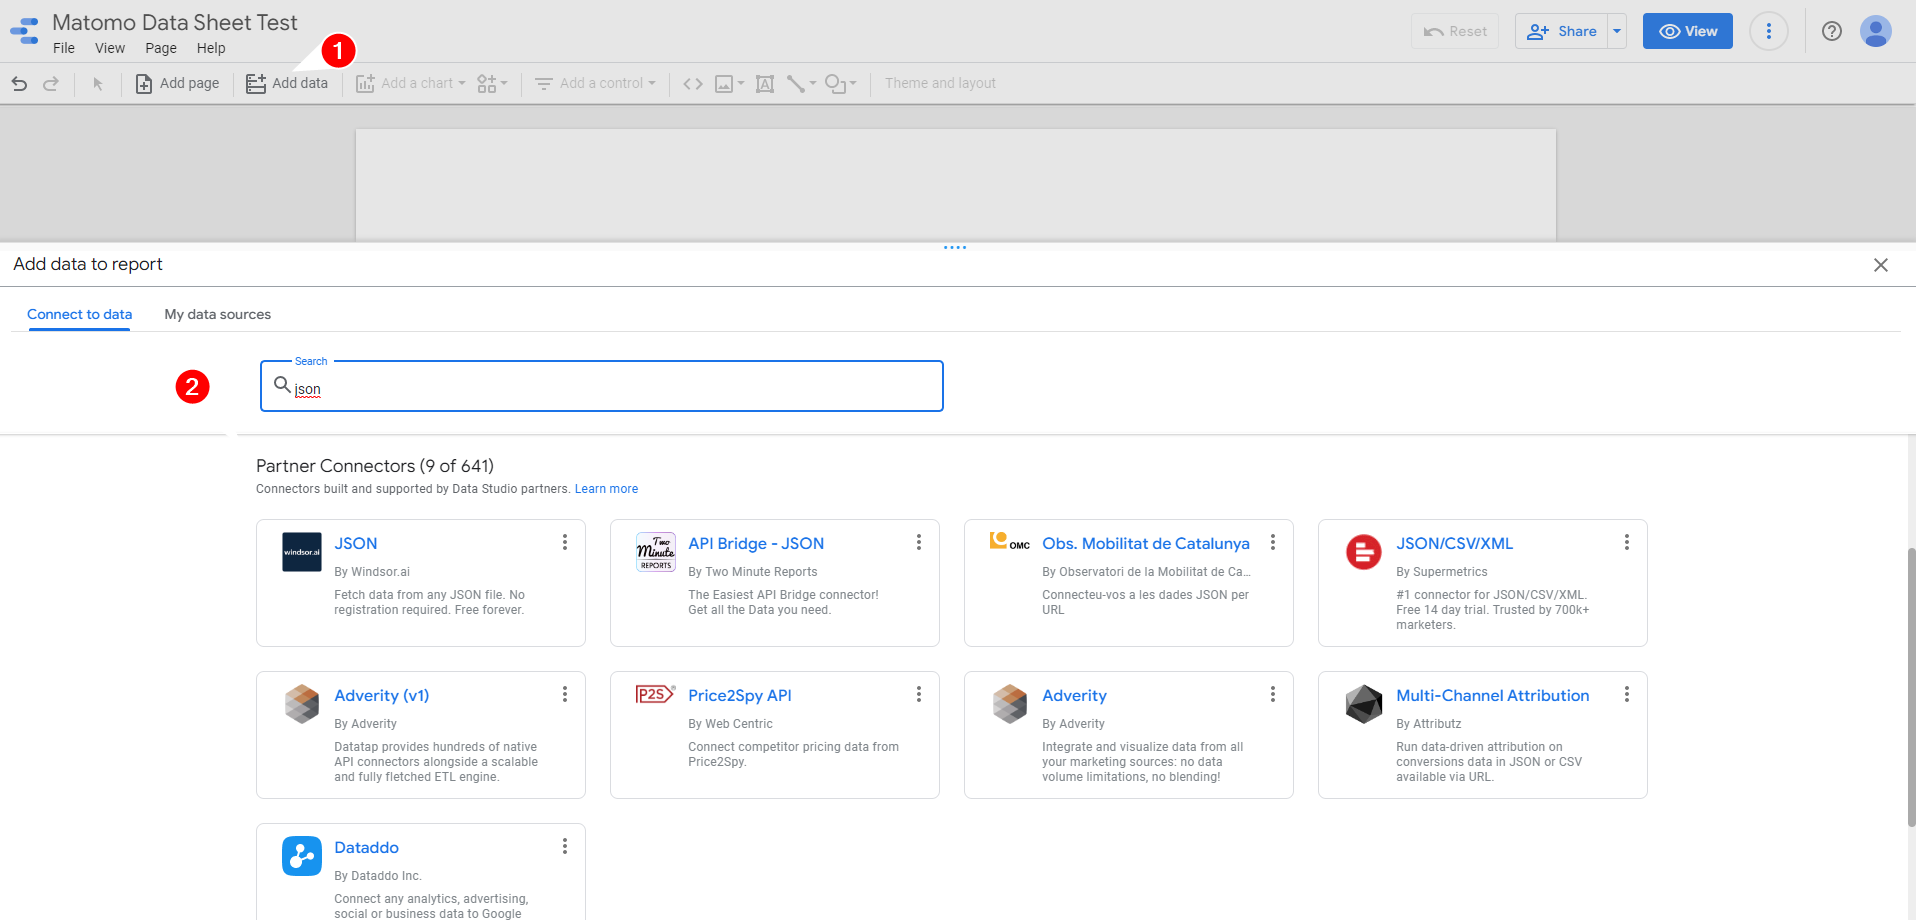
No, thanks, we are a cheap date!
You know what's free? Google Sheets Connector, Google Sheets and your personal data that evil service is harvesting. So we are using that (really the irony to get rid of Google Analytics and then use their service to create charts :D)
Google Sheets as Cheap JSON Connector
I expect you to know some basics about Google Sheets and App Scripts or Macros, if not follow these steps and if you get stuck somewhere, click around like a wild monkey until it works.
1. Get the Matomo endpoint you want to turn into a chart
Go to the section with the data you are interested in
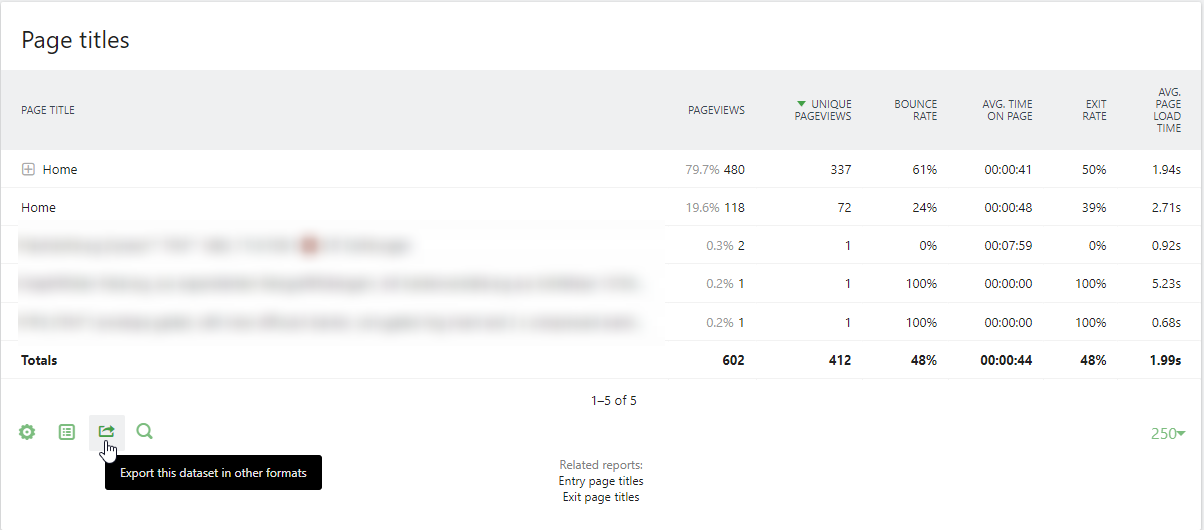
Export (or better generate a link to) the data as (1) JSON, make sure the data structure is flattened (2) so it's table like, and you got a token generated within Matomo so you can access the data without logging in.
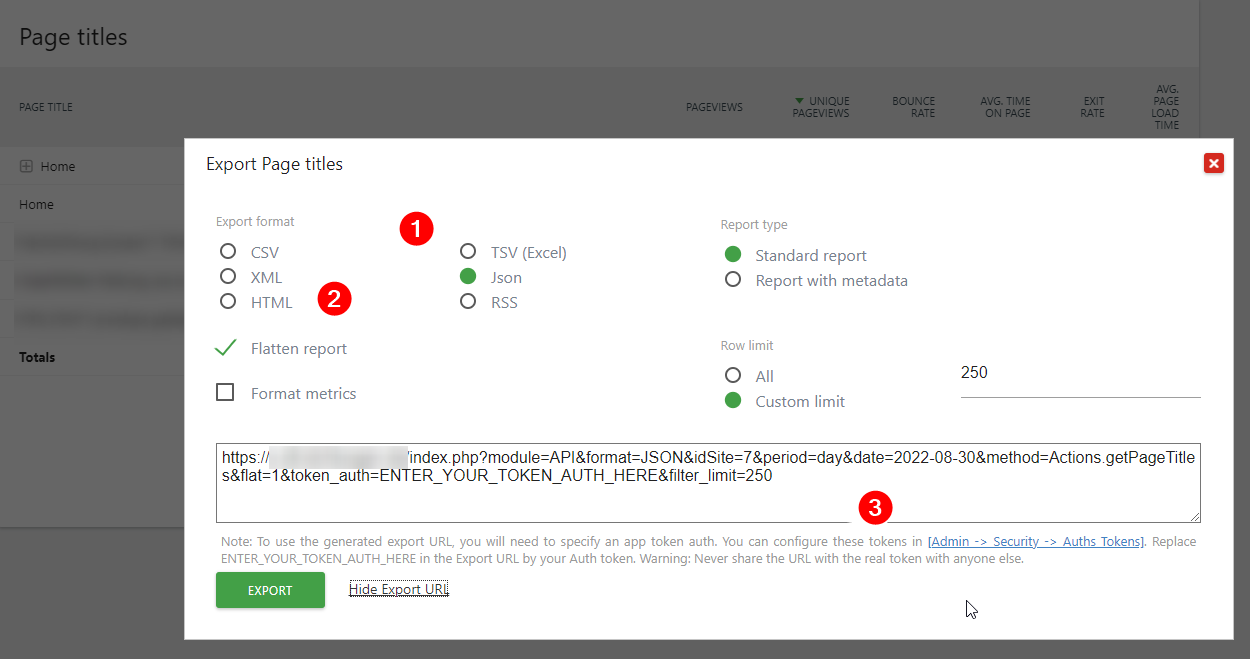
For this demo I'm using a link to the Matomo demo instance:
https://demo.matomo.cloud/?module=API&method=Actions.getPageTitles&idSite=1&period=day&date=yesterday&format=JSON&token_auth=anonymous&flat=1
All options are described in the Matomo HTTP API docs.
2. Create a new Google Sheet
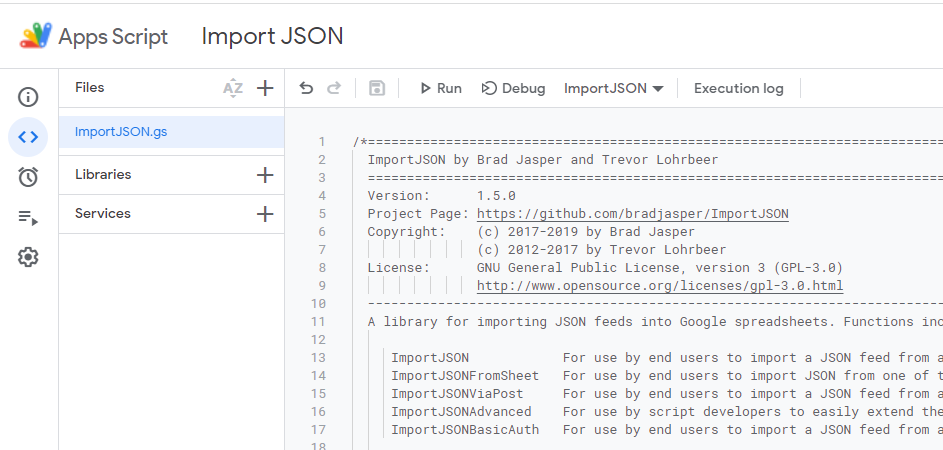
Just create a new empty sheet and already open the App Script Editor:

3. ImportJSON Magic
Google Sheets has several commands to import external data, like RSS Feeds, HTML, CSV
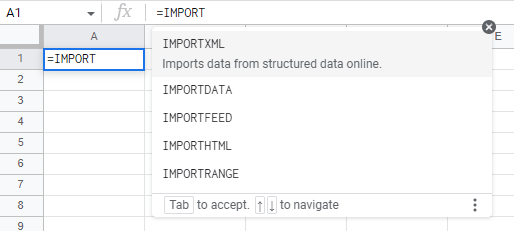
And yes, Matomo data can be gathered not only as JSON but also as CSV, but this is about JSON an how to get a free connector.
With ImportJSON exists a pretty nice toolset to make API calls (even POST calls) inside Google Sheets and turn JSON into tabular data.
Copy the source code of ImportJSON.gs https://raw.githubusercontent.com/bradjasper/ImportJSON/master/ImportJSON.gs into the Google Script Editor:
Go back to your Google Sheets Sheet and check if ImportJSON shows up
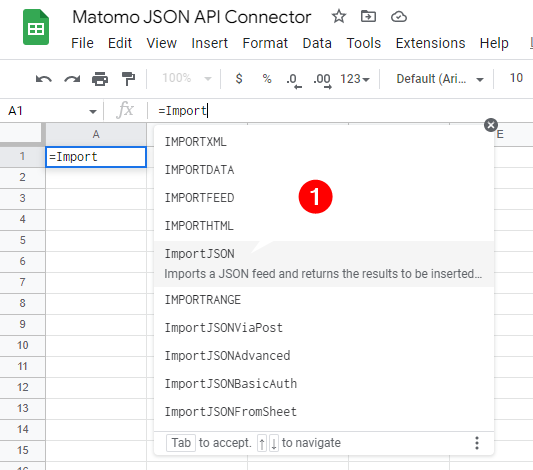
(I don't know if it's immediately available or if you have to grand access to your data. Since I did the demo before, it didn't ask me again)
Put the following formula into the first cell (1) - give the data sheet a proper name (2)
=ImportJSON("https://demo.matomo.cloud/?module=API&method=Actions.getPageTitles&idSite=1&period=day&date=yesterday&format=JSON&token_auth=anonymous&flat=1")
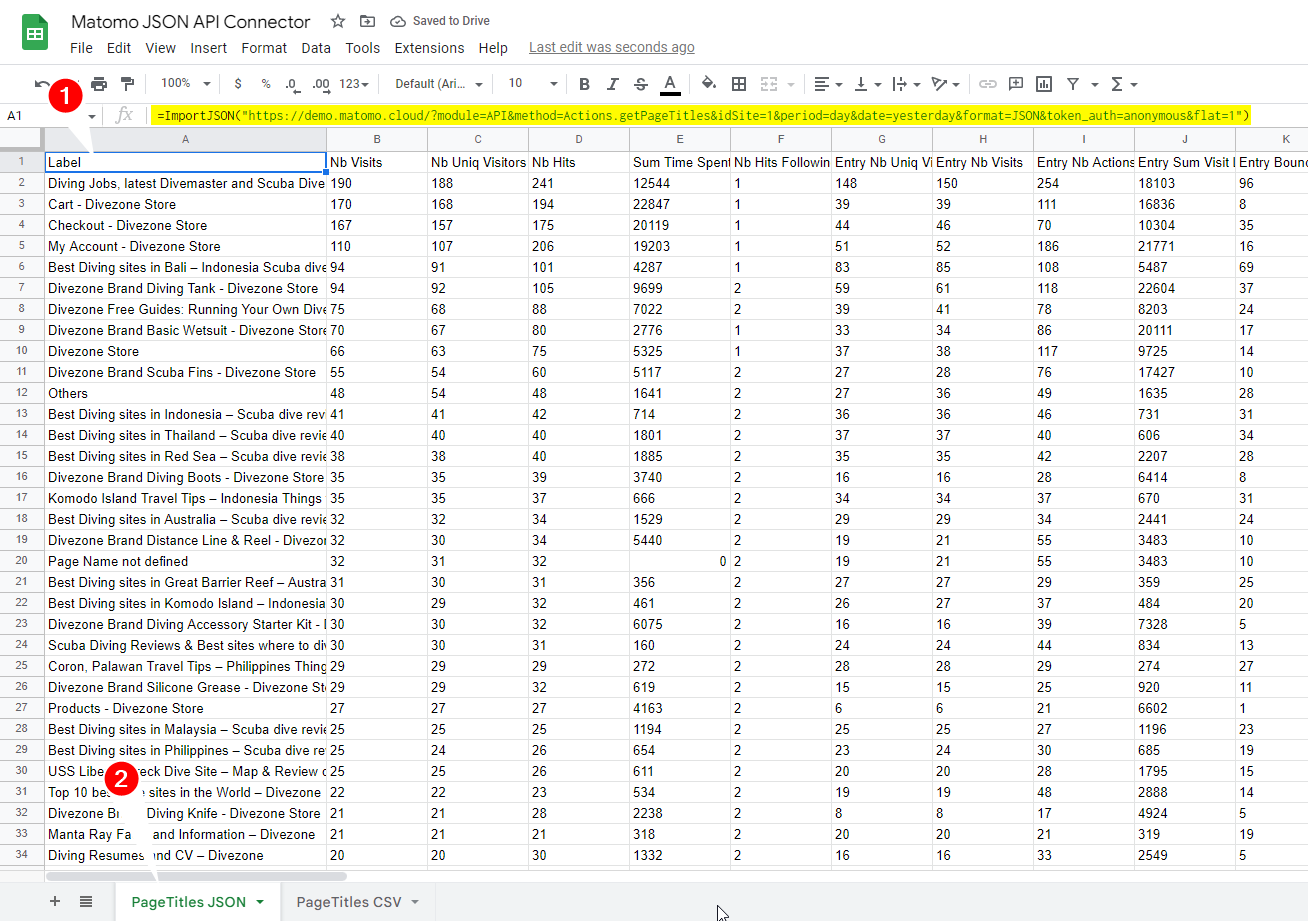
And voila - JSON turned to tabular data.
Edit 2022-09-02
I had some problems with data not being refreshed in Google Data Studio, assuming the function gets triggered every time the table gets fetched. That doesn't seem to be true.
This blog post explains how to use ImportJSON with a time based trigger. So you have to add that to this demo!
3.1. IMPORTDATA() Magic
As mentioned before if you have access to CSV data via API just use IMPORTDATA
The Link to the API looks like this
https://demo.matomo.cloud/?module=API&method=Actions.getPageTitles&idSite=1&period=day&date=yesterday&format=CSV&token_auth=anonymous&flat=1&translateColumnNames=1&convertToUnicode=0
translateColumnNames turns the original column names like nb_visit into human-readable column names as you know them from Matomo. convertToUnicode=0 was important too, but I don't remember why.
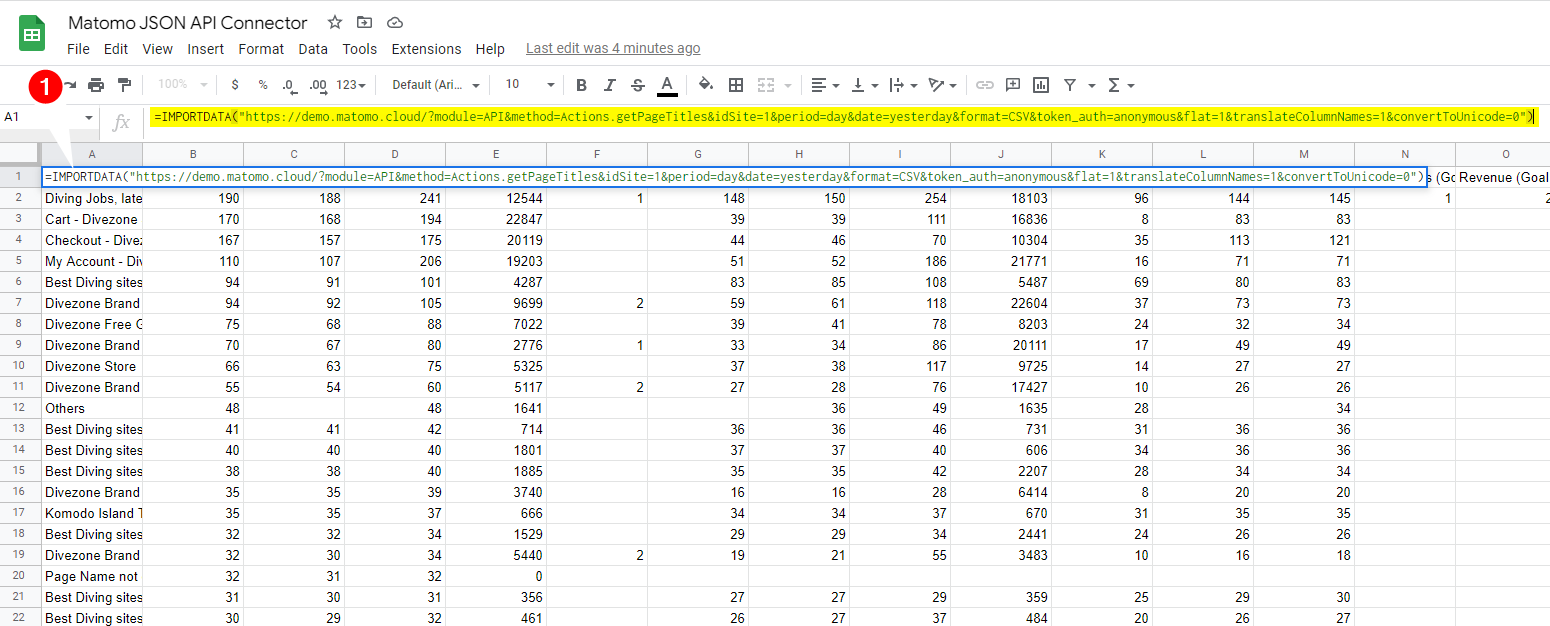
Then place the formula into the first cell and you are done.
=IMPORTDATA("https://demo.matomo.cloud/?module=API&method=Actions.getPageTitles&idSite=1&period=day&date=yesterday&format=CSV&token_auth=anonymous&flat=1&translateColumnNames=1&convertToUnicode=0")
4. Connect the sheet with Google Data
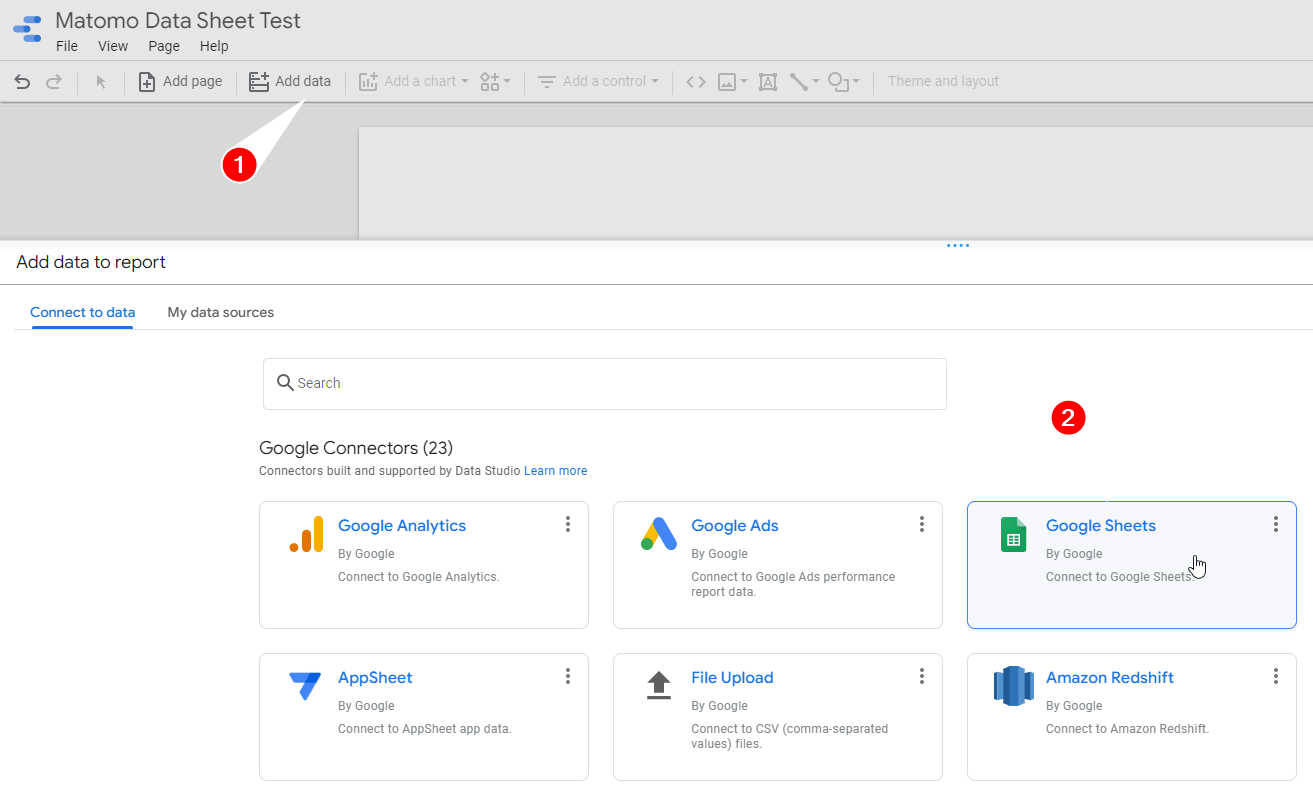
Select Add Data (1) and select Google Sheets (2)
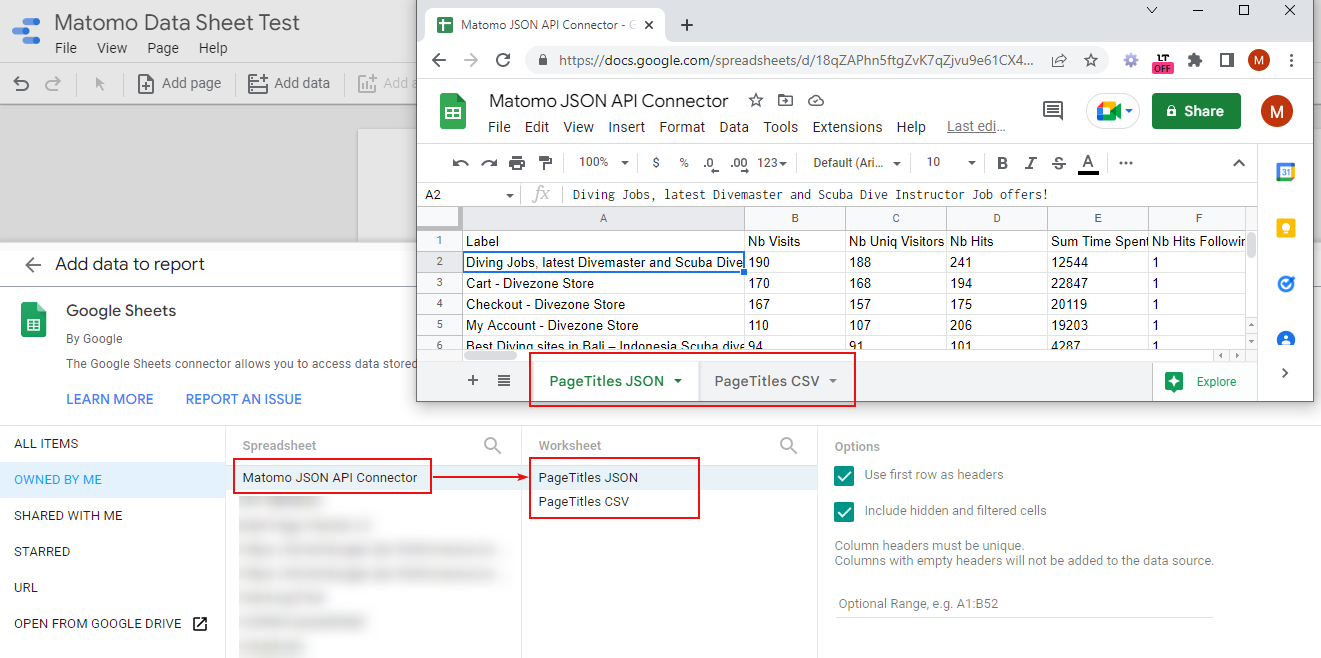
Find the table and the correct sheet.
Add a table chart or whatever you like
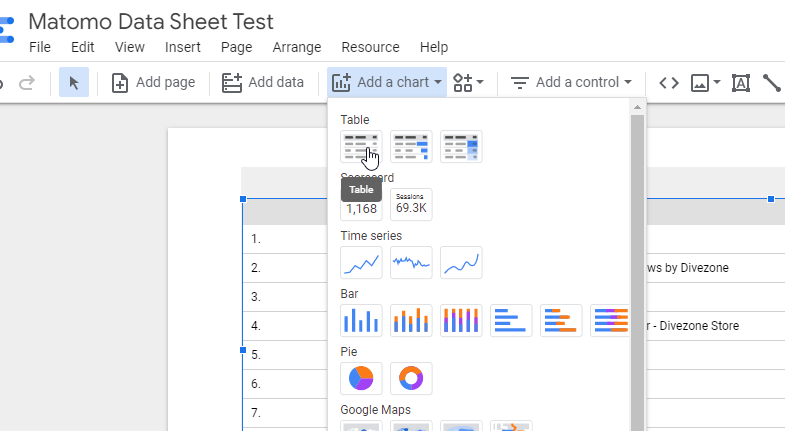

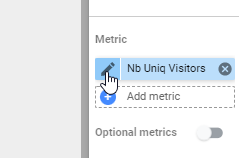
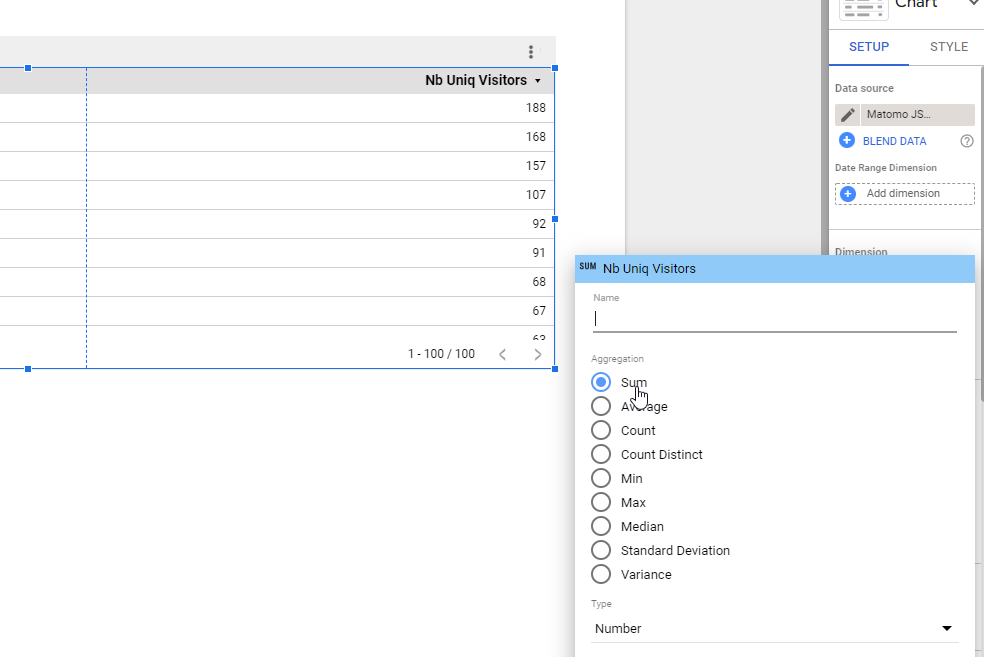
and then format the table, which is a whole other post I'm not going to write, because there are enough resources out there. Just for the sake of this demo, since some numeric values are string data types and therefore not usable for aggregate function in Data Studio we have to set the right type for Nb Uniq Visitors.
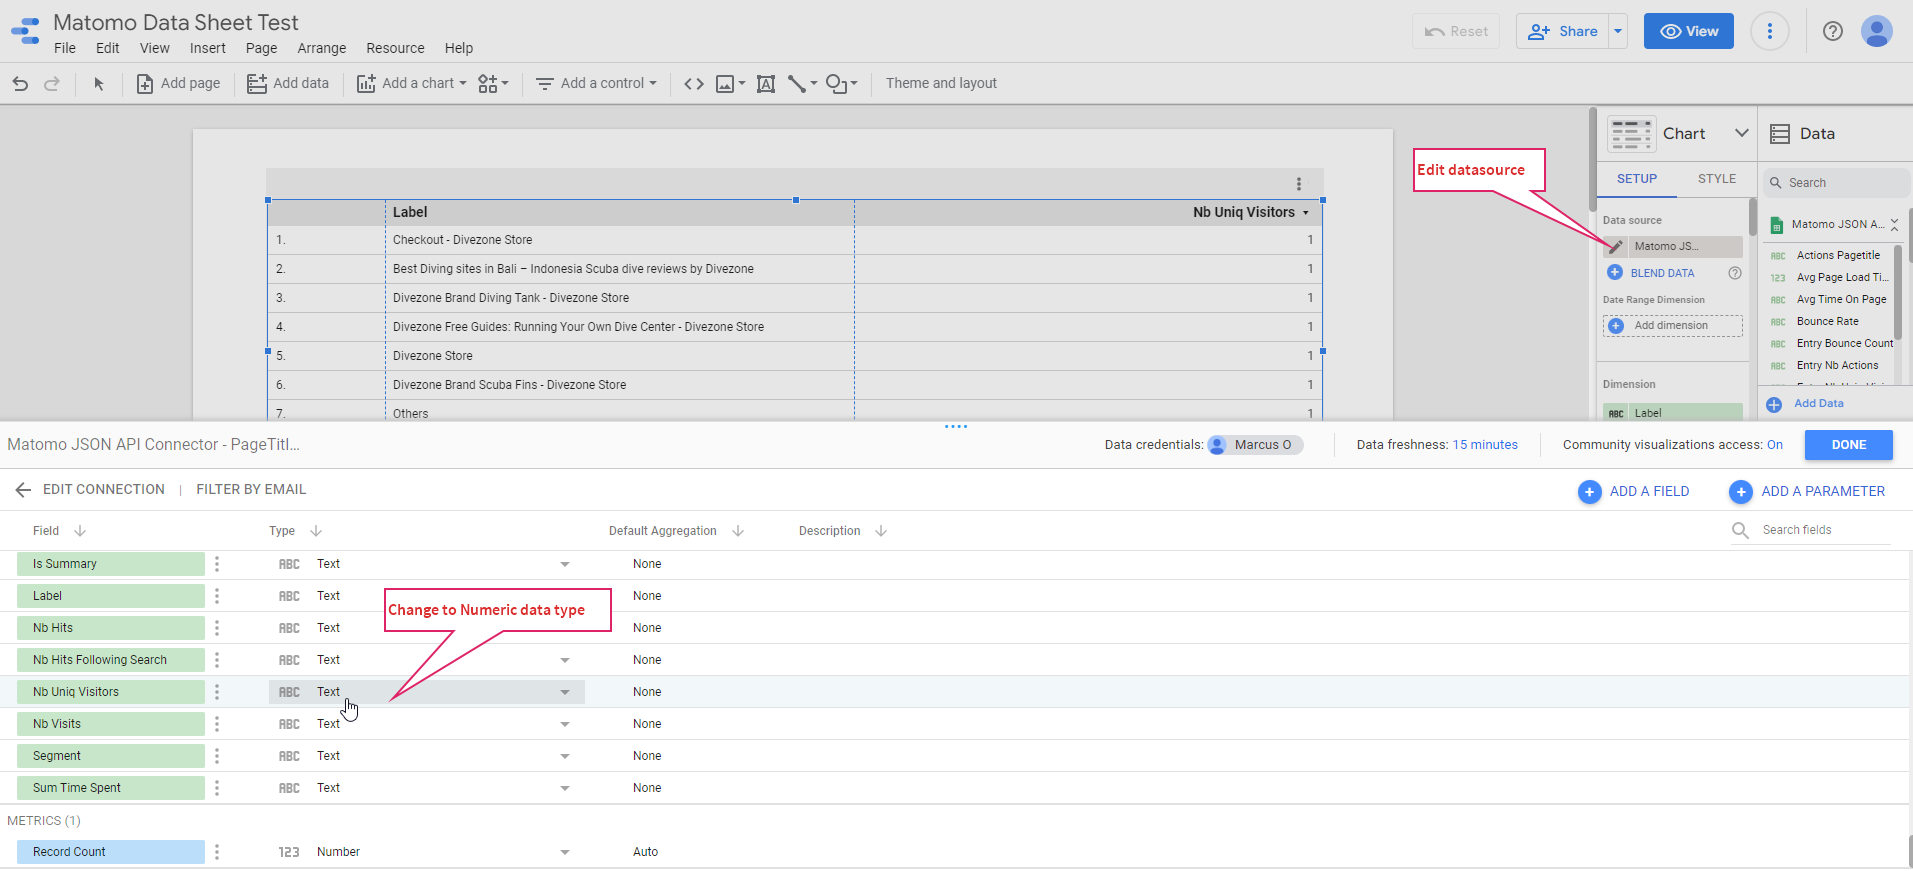
Change aggregation to SUM
And then add bars to the metrics if they aren't there yet:
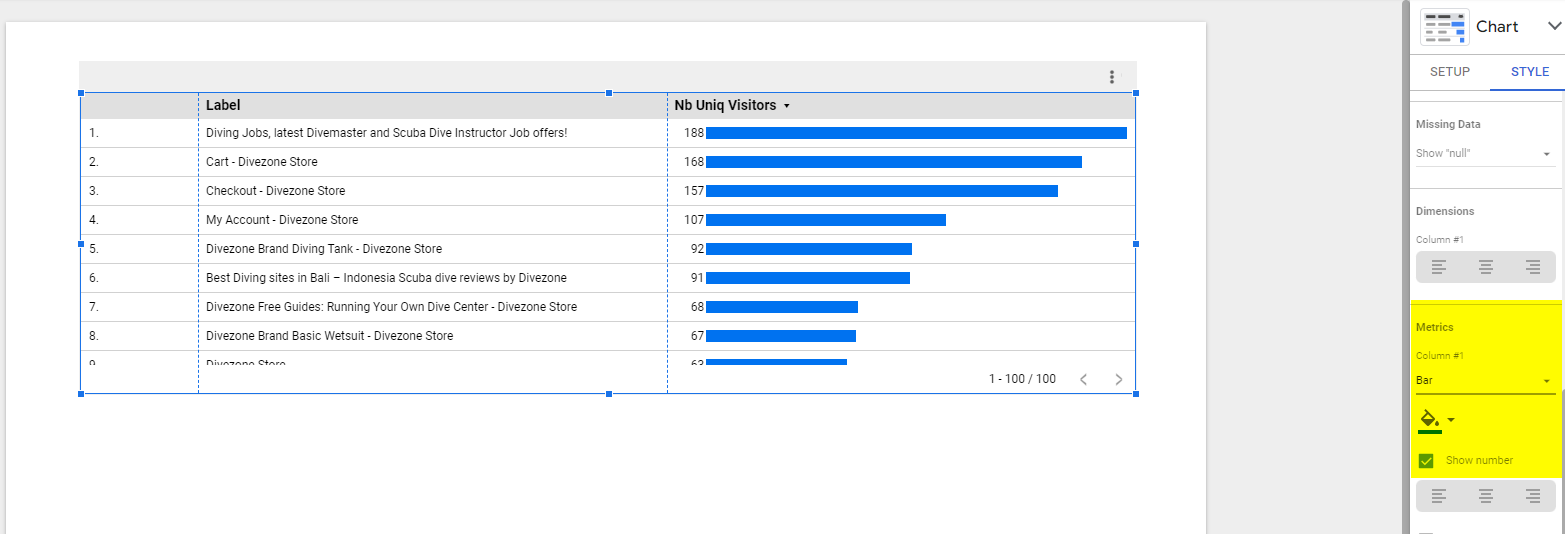
Boom, that's it - free JSON connector for Google Data Studio!
https://datastudio.google.com/reporting/e686c3c1-94d0-41c2-90d0-75f2bffa3f0f
For each metric (data per day, week month) you have to setup a single purpose sheet with an ImportJSON call (or IMPOTDATA in this case).
Hope that works for you!
Bonus
I got a bit of inspiration from this gorgeous implementation of Google Search Console API into Google Data Stadio
